Skills
How to read a topo map
Every brown line joins ground at the same height, and how tightly they're packed is how steep the slope is. Learn that, plus four numbers off the sheet, and you can figure out whether a route goes before you ever leave the kitchen table.
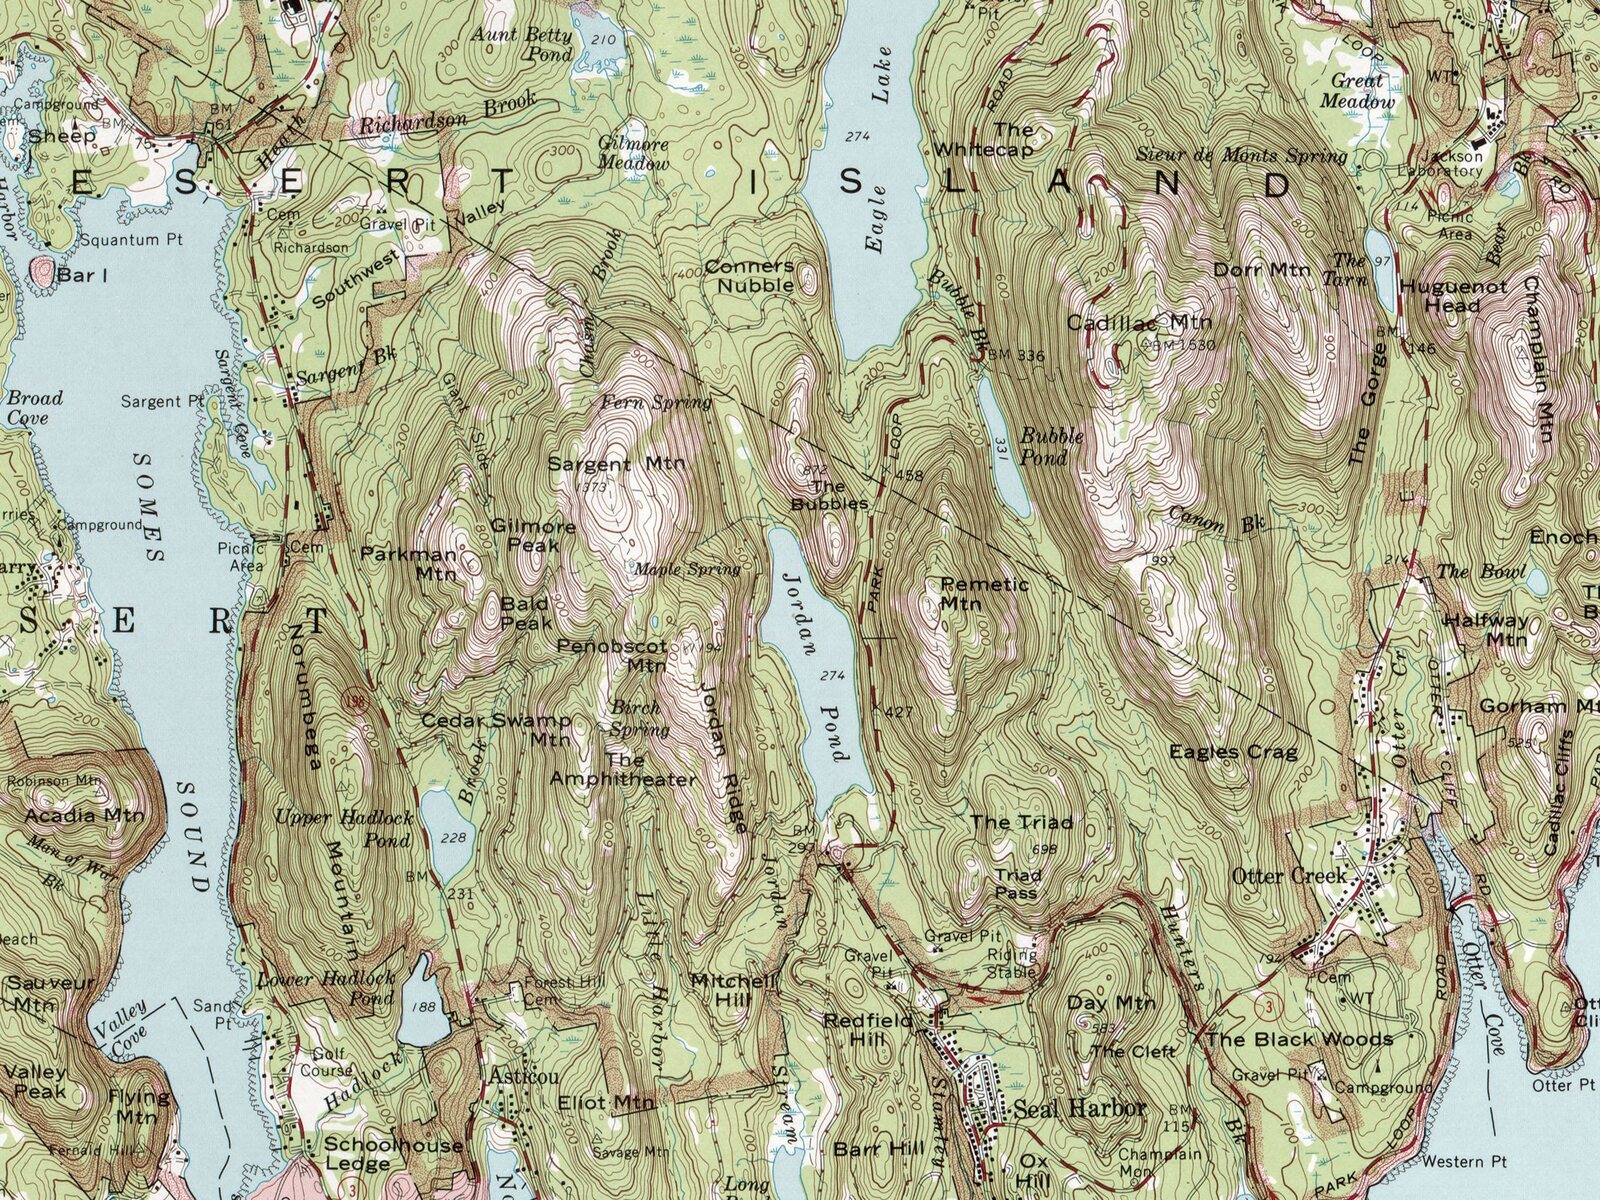
Most maps tell you where things are. A topographic map tells you what the ground does between them, and it runs on one idea repeated a few thousand times. Every brown line joins points that sit at the same height above sea level. Walk along one and you stay level. Cross one and you've gained or lost a fixed amount of height, and that amount is printed in the margin.
The rest follows from that. Lines crowded together mean the height is changing fast over very little ground, which is a steep slope. Lines spread wide apart mean gentle going. Rings inside rings are a summit. A notch where two sets of lines pinch together and then fall away on both sides is a saddle, and a saddle is usually where the trail crosses the ridge. The USGS puts it plainly: contours that are very close together represent steep slopes, and widely spaced contours mean the ground is relatively level.
None of that is hard. What takes practice is doing it in the right order, because a shape means nothing until you know what one line is worth.
Read the map in this order
The first two steps take about ten seconds each and they're the ones people skip. Reading contour shapes on a map whose interval you never checked is how a route that looked fine turns out to climb 2,000 feet.
- 01
Start in the margin, not the middle
The margin carries the scale, the contour interval and the date. All three change what the middle of the map means. A slope drawn with 20-foot contours and the same slope drawn with 100-foot contours look completely different on paper and are the same hill.
The contour interval is printed in the margin of every USGS map. Find it before you look at anything else.
- 02
Find the index contours and get a height
Some of the brown lines are drawn heavier and carry a printed elevation. Those are index contours, typically every fifth line, and the thinner intermediate contours in between fill in the shape. Read two index contours and you know both roughly how high you are and which way is uphill. A stack of unlabeled lines won't tell you either one.
- 03
Read the spacing before you read the shapes
Run your eye along the route you're thinking about and look at how the lines bunch. Tight bands are climbs. Long gaps with no lines at all are flat ground. You can do this in about five seconds per mile and it settles most of the question of whether a day is realistic.
- 04
Follow the blue
Water is the other half of the terrain. Where a contour crosses a stream it bends and points upstream, so the blue lines and the brown Vs together show you every drainage on the sheet, including the dry ones. A solid blue line is a perennial stream; a dashed or dotted one is intermittent, which on an August afternoon is the difference between a water stop and a dry gully.
- 05
Deal with north last, and do it properly
The top of the map is true north. Your compass needle isn't pointing there. Until you've applied the current magnetic declination for where you actually are, any bearing you take off the map is wrong by however many degrees that gap happens to be.
The four numbers worth knowing
- 1:24,000
- The standard US quad scale
- 40–80 ft
- Common contour interval
- Every 5th
- Line is an index contour
- 49–70 sq mi
- Ground on one 7.5-minute sheet
One inch on the paper is 24,000 inches of ground, or 2,000 feet
But flat country is often mapped at 10 feet and big mountains at 100 or more
Drawn heavier, with its elevation printed along it in several places
Latitude decides it: 49 square miles at 49°N, 64 at 30°N, up to 70 nearer the equator
Turning spacing into an actual number
Eyeballing the bunching gets you most of the way. When you want to know whether something goes, do the arithmetic instead. It takes longer to describe than to do.
On a 1:24,000 map, one inch of paper is 2,000 feet of ground. Say the interval is 40 feet, and along the stretch you're worried about you count ten lines crossing half an inch. That's 400 feet of climb in 1,000 feet of walking: a 40 percent grade, which is stair-stepping and hands-on-knees rather than walking. For comparison, 1,000 feet of gain spread over a full mile, a climb most people would call steep, works out to about 19 percent.
The same arithmetic tells you when to stop looking. Ten lines packed into a tenth of an inch is 400 feet of climb in 200 feet of ground, and no trail does that. What you're looking at is a cliff, and by then the contours have usually merged into a single brown smear anyway.
One limit worth holding onto: contours can't show you anything that happens between them. On a 40-foot interval, a 35-foot band of cliff can sit in the gap between two lines and leave no trace on the paper at all. The National Map Accuracy Standards ask that 90 percent of tested elevations fall within half the contour interval. That tells you how accurate the lines themselves are. It says nothing about what sits in the gaps.
The shapes, and what they are on the ground
- Contour interval
- The height difference between one line and the next. Printed in the margin, constant across the whole sheet, and the single number that decides what every shape on the map means.
- Index contour
- The heavier line, usually every fifth one, with its elevation printed along it. The thinner lines between are intermediate contours; some maps add lighter supplementary contours where the ground is too flat for the standard interval to show anything.
- Rule of Vs
- Where a contour crosses a stream it bends into a V, and the point of the V faces upstream. The reason is geometry: the streambed is lower than the ground on either side, so the line has to travel further up the valley to stay at the same height.
- Spur
- A rib of high ground running down off a ridge. On paper the contours bulge outward and downhill, the opposite of a drainage and the mirror image of the V.
- Draw
- The small drainage between two spurs, often dry. It shows as a run of tight Vs pointing uphill with no blue line in them. Steeper and more overgrown than it looks on paper.
- Saddle
- The low point on a ridge between two summits, drawn as an hourglass of contours pinching in and opening out again. Marked on US maps as a gap, col, notch or pass depending on the region, and almost always where a trail chooses to cross.
- Depression
- A closed hollow rather than a hill. It's drawn with short ticks called hachures on the inside of the closed contour, pointing down the slope. Without the ticks a sinkhole and a summit look identical.
- Benchmark
- A surveyed point with a known elevation, printed as BM and a number, usually next to a small triangle or cross. A plain number with an x beside it is a spot elevation: measured, but without a physical marker in the ground.
- Contours never cross
- One piece of ground can't be at two heights, so the lines never fork or intersect. Where they appear to merge into one thick band, the ground is vertical or close to it.
Close lines mean steep; far-apart lines mean flat. Get that one sentence into your head and the rest of the sheet is detail.
Which scale to carry
Scale is a trade between detail and how much country fits on one sheet. For walking, larger is nearly always better.
| Scale | One inch is | One sheet covers | What it is good for |
|---|---|---|---|
| 1:24,000, the 7.5-minute quad | 2,000 feet | 49–70 square miles | Walking. Individual switchbacks, small streams, buildings and fence lines |
| 1:62,500, the old 15-minute | About a mile | Roughly four 7.5-minute quads | Superseded, but still what many older park sheets are. Fine for a route, thin on detail |
| 1:100,000 | About 1.6 miles | A 30 × 60-minute block | Planning a multi-day line across a region, then dropping to a bigger scale for the walking |
| 1:250,000 | About 4 miles | 1 × 2 degrees of the map grid | Getting there. Not a navigation map for anyone on foot |
Alaska is the exception. Its classic quads are 1:63,360, where one inch is exactly one mile. The USGS started replacing them in 2013 with 7.5-minute sheets at 1:25,000.
What the map knows, and what it doesn't
A topographic map is a survey of the shape of the ground, and the shape of the ground barely changes. The rest of what's printed there has a shelf life.
Reliable
- The shape of the terrain: ridges, drainages, saddles, how steep a face is
- Elevations, to within about half the contour interval on 90 percent of tested points
- Where water collects and which way it runs
- Distance, once you've got the scale, and none of it needs a battery
Check elsewhere
- Whether that dashed trail still exists, or was ever more than a survey line
- Blowdown, washouts, lingering snow, a bridge that went out in the spring
- Current closures, permits and fire restrictions. None of that is cartography
- Whether an intermittent stream is running this month
- Anything that changed after the survey date printed in the margin, which on older sheets is measured in decades
If you carry a screen too
Paper doesn't run out of battery, and that's the main reason to have it. A GPS watch answers a different question, which is where you're standing right now, so carry both if you can.

Common questions
What is a contour interval?
The height difference between one contour line and the next. On a 40-foot interval, crossing one line means you've gone up or down 40 feet. It's constant across a sheet and printed in the margin. USGS picks it to suit the terrain: flat country is often mapped at 10 feet or less, and mountainous country at 100 feet or more so the lines don't run into each other.
What do the colors on a topographic map mean?
Brown is contours. Blue is water: lakes, streams, ditches. Green is woodland and other vegetation. Black is roads, trails, railroads, boundaries and buildings, with red used for important roads and land grids. Purple, where you see it on an older sheet, marks features added from aerial photographs that were never checked on the ground.
How do I tell a hill from a hole?
By the ticks. Both are closed loops, but a depression is drawn with short hachure marks on the inside of the contour, pointing down into the hollow. No ticks means high ground.
Which way is the stream flowing?
Look at where the contours cross it. They bend into a V and the point of the V faces upstream, so the water runs the other way, out of the point of the V. This works on dry drainages too, which is how you spot a gully that only carries water after rain.
Do I still need a paper map if I have GPS on my phone?
Paper wins on staying power rather than accuracy. A phone or a watch is far quicker at telling you where you're standing; paper is what's left when the battery dies, the screen cracks or the cold shuts the thing down mid-afternoon. Carry both, and learn the one that doesn't need charging.
Where do USGS topographic maps come from?
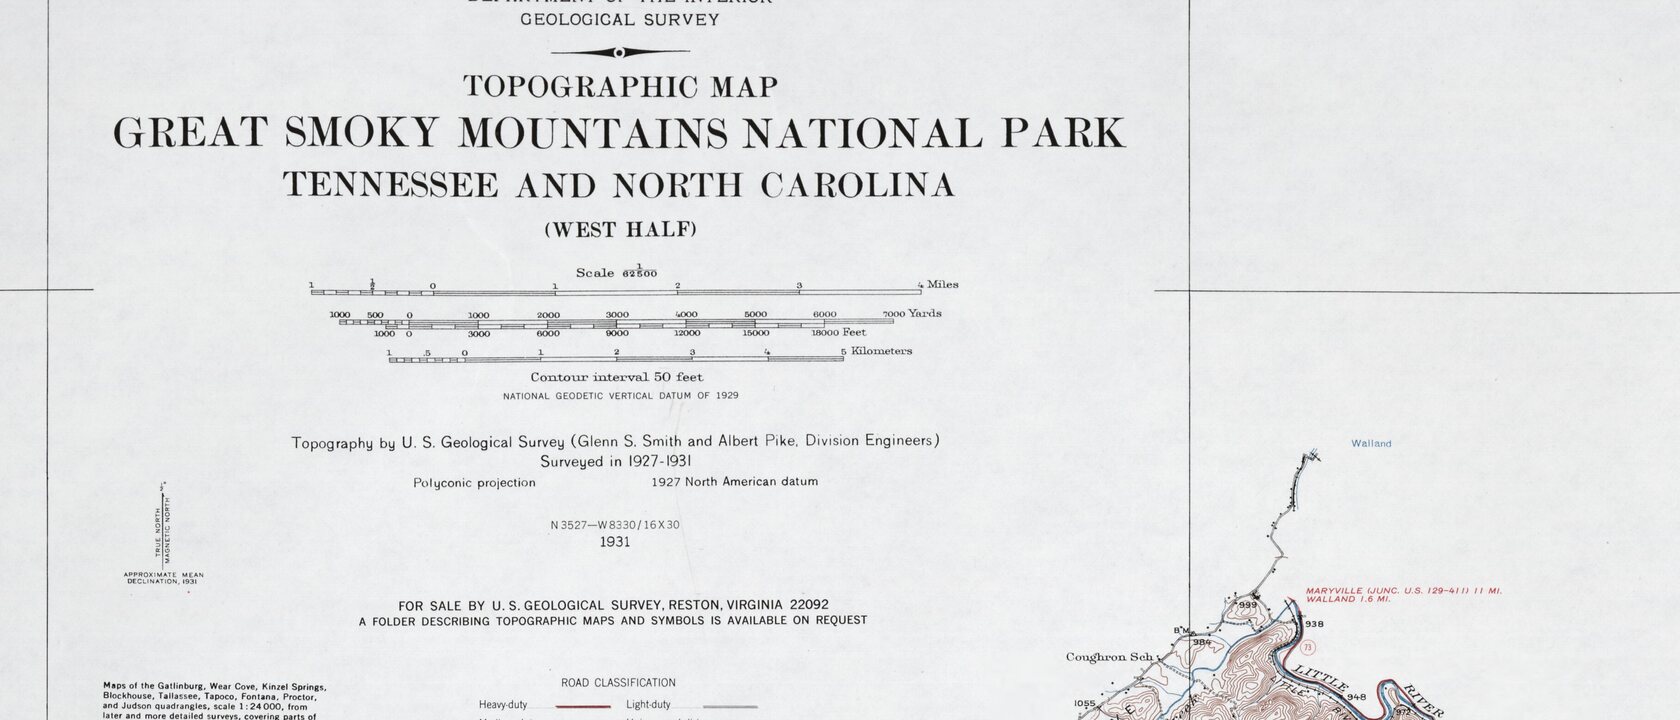
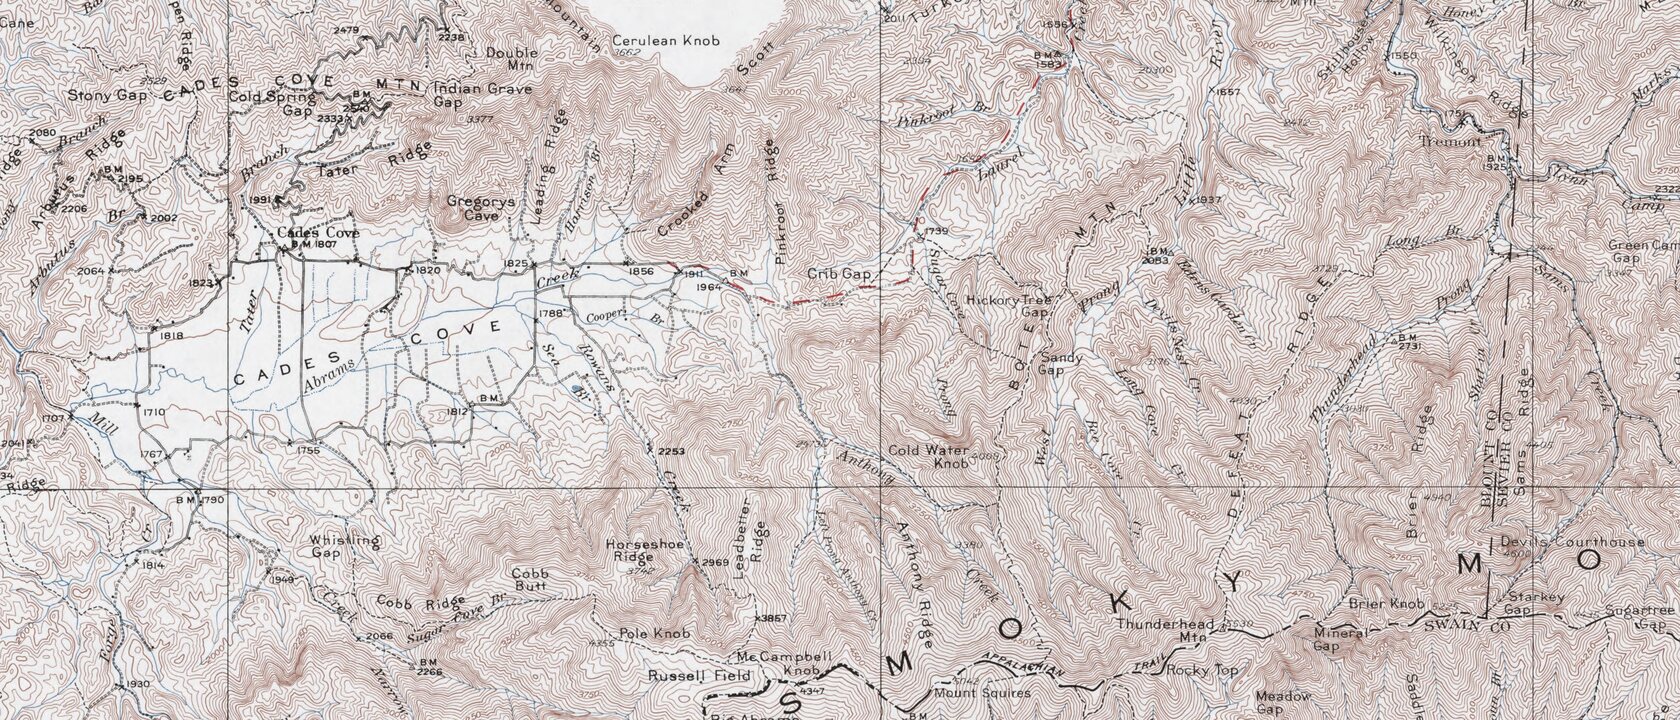
The USGS produced its first topographic map in 1879 and has been mapping the country ever since. The 7.5-minute, 1:24,000-scale quadrangle series is the familiar one, more than 54,000 sheets covering the lower 48 and Hawaii. USGS maps aren't copyrighted, which is why the two sheets pictured in this article could be reproduced here at all.
Sources
Facts on this page were checked against these. Conditions, fees and rules change — check the official page before you go.
- Topographic Map Symbols — U.S. Geological Survey · checked August 4, 2026
- Topographic Mapping — U.S. Geological Survey · checked August 4, 2026
- USGS Maps — U.S. Geological Survey · checked August 4, 2026
- Map Scales (Fact Sheet 015-02) — U.S. Geological Survey · checked August 4, 2026
- USGS US Topo Maps for Alaska — U.S. Geological Survey · checked August 4, 2026
- Magnetic Declination — NOAA National Centers for Environmental Information · checked August 4, 2026
- Help: Magnetic Declination Calculator — NOAA National Centers for Environmental Information · checked August 4, 2026
- Hiking Maps and Why You Need Them — Washington Trails Association · checked August 4, 2026
- How to Find Your Way: Navigate on Trail Using Orienteering Skills — Washington Trails Association · checked August 4, 2026
- 7.3: Contour Lines — Geosciences LibreTexts · checked August 4, 2026
More from Basecamp
Safety
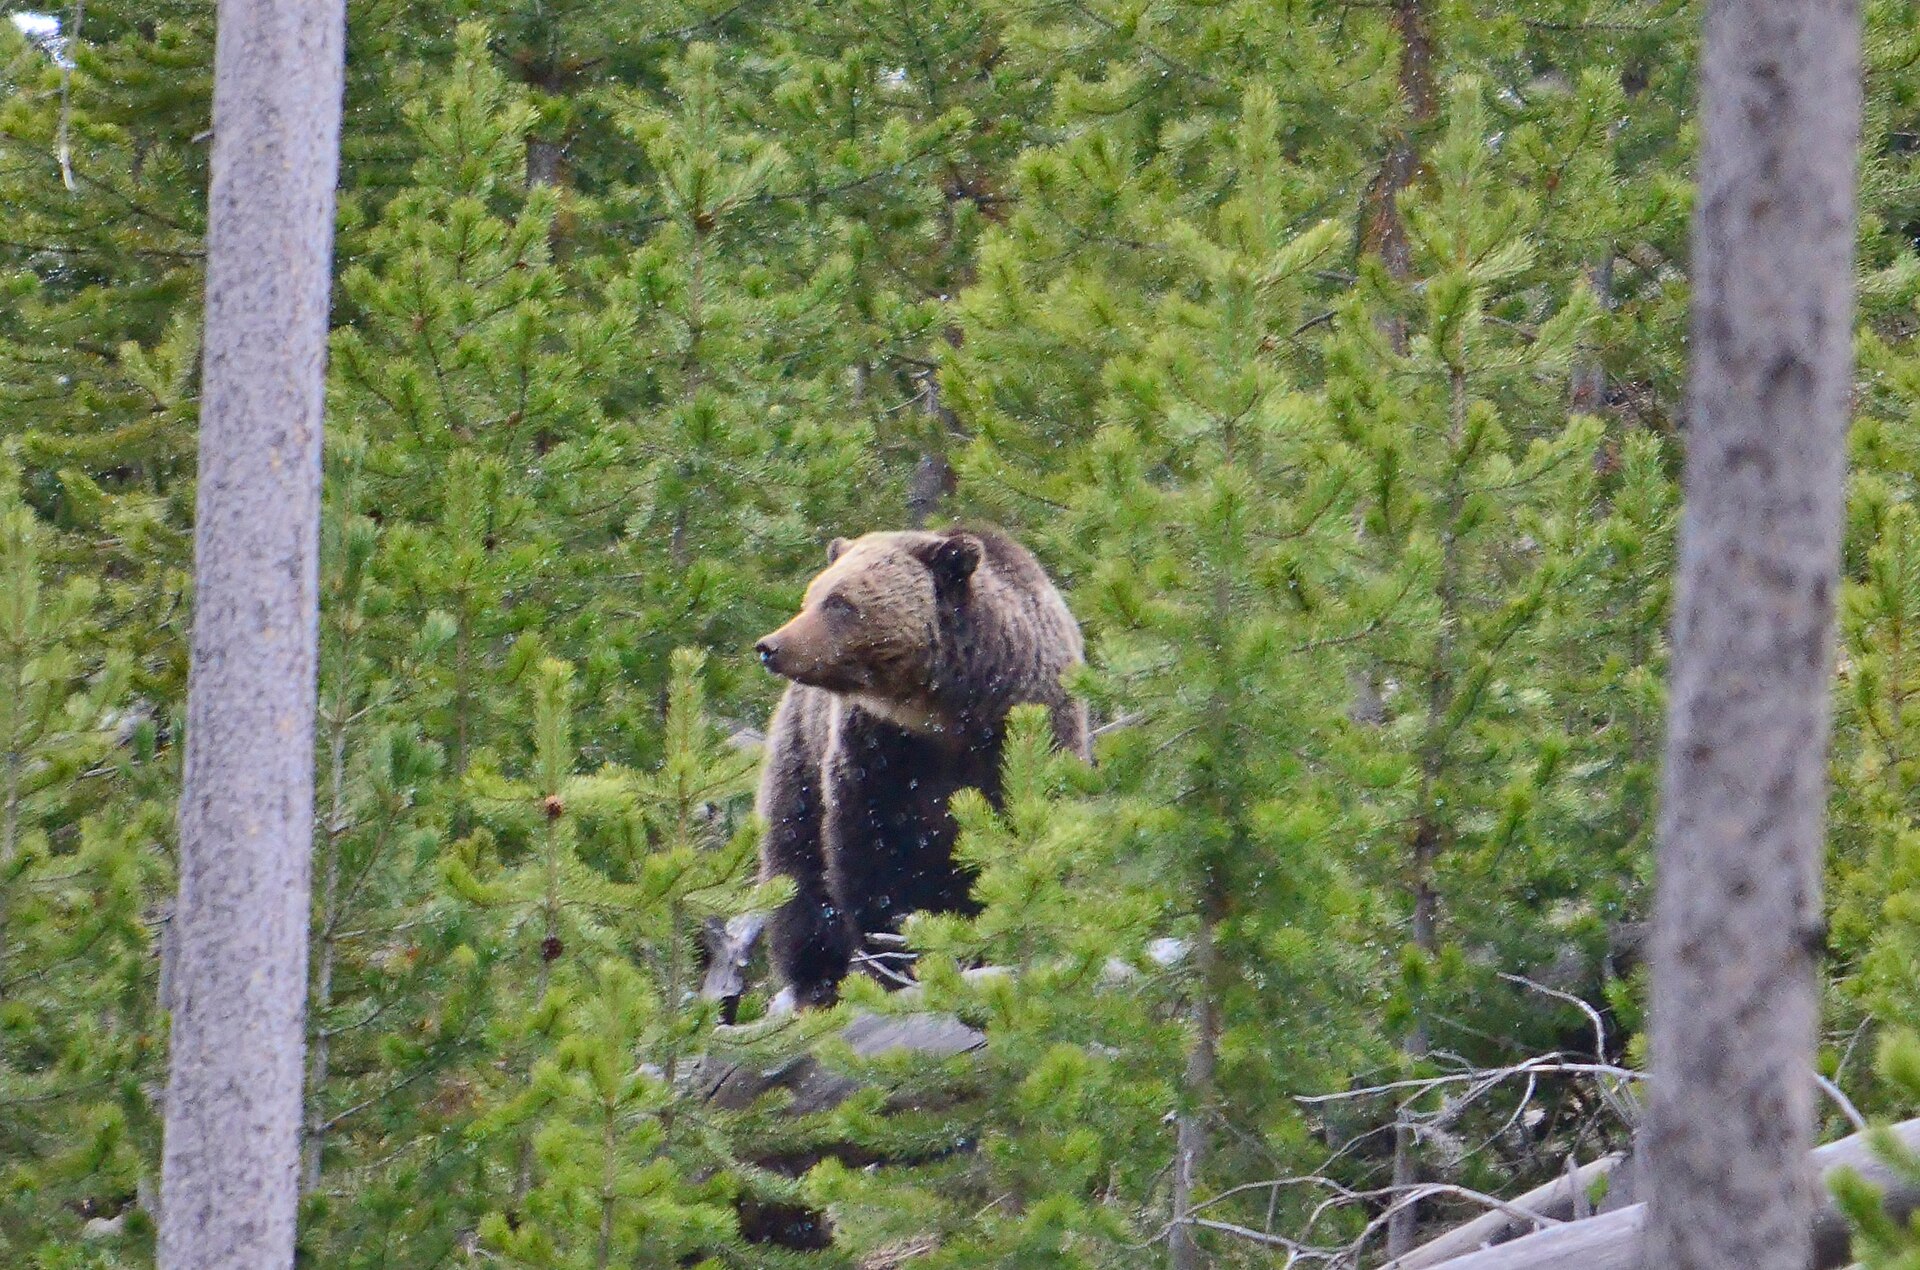
Hiking in bear country
Grizzlies and black bears call for opposite responses, so the first job is figuring out which one you're looking at. Here's what the land managers tell you to do before the trailhead, on the trail, and if a bear is coming at you.
Safety
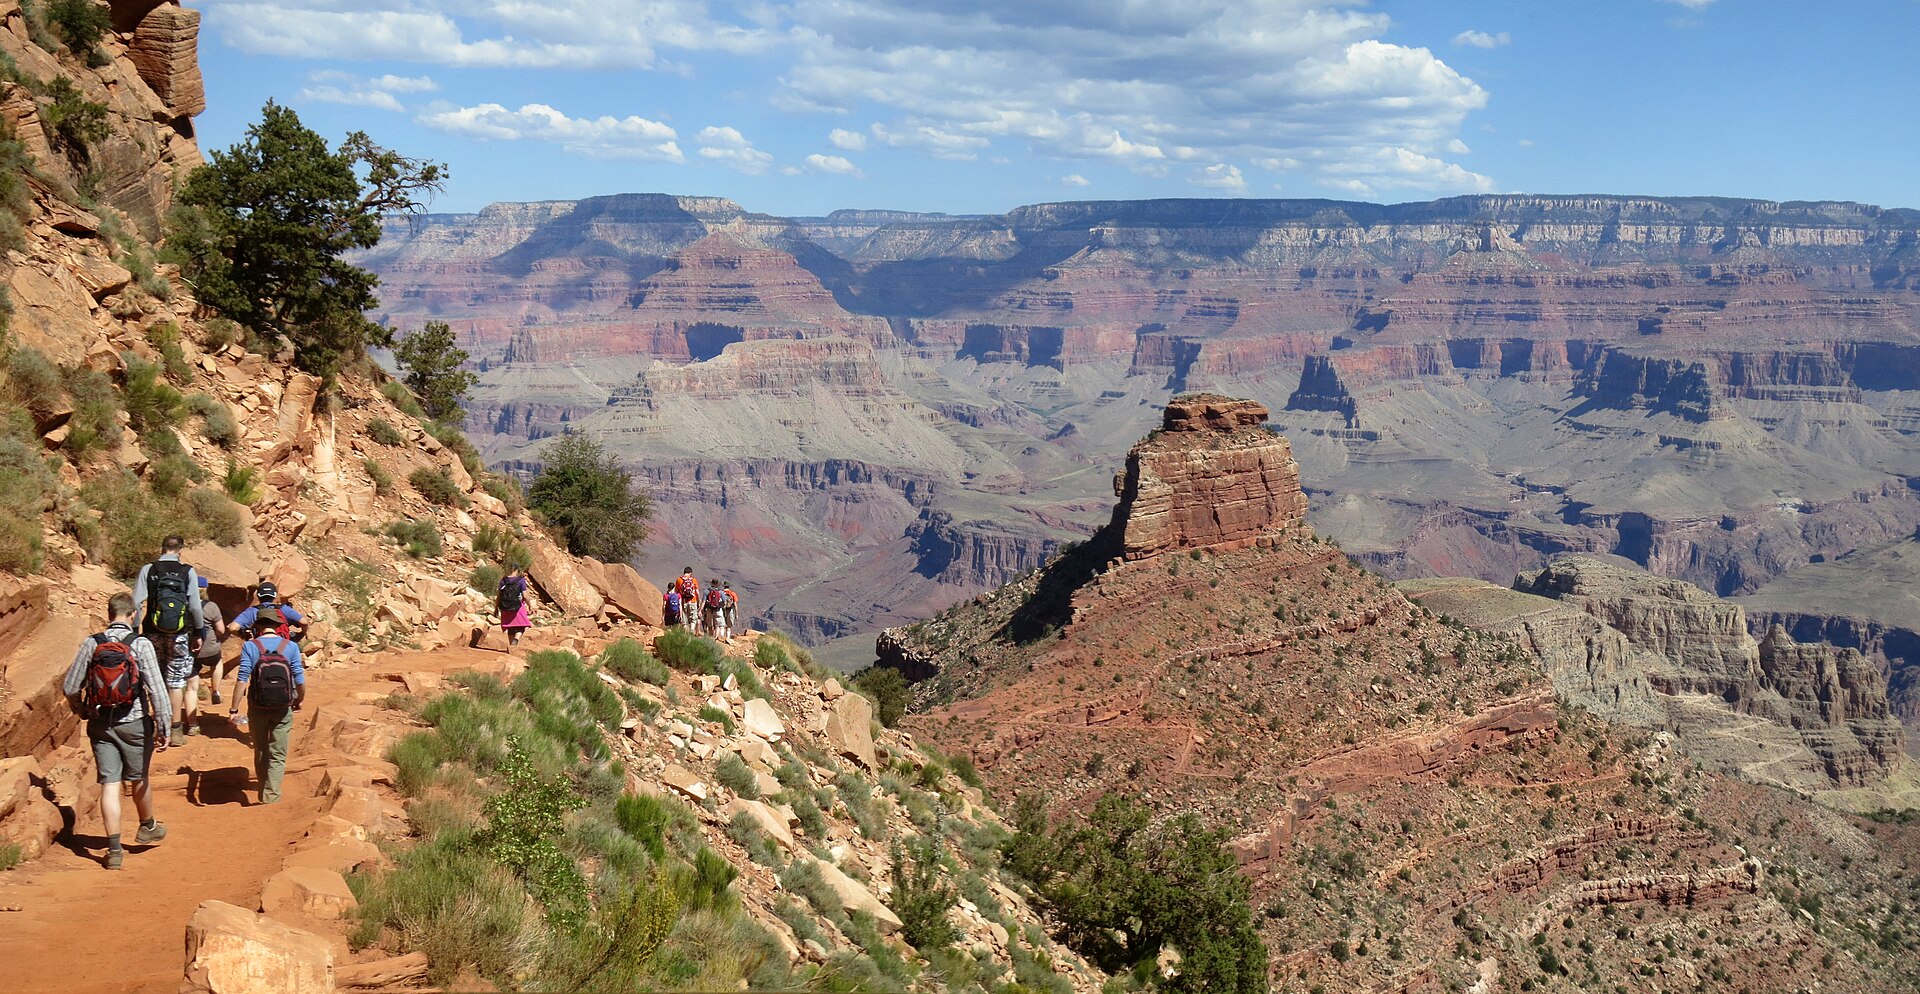
Hiking in the heat
Three things put hikers down on a hot day, and two of them look alike while needing opposite treatment. The fixes are mostly a start time and a turnaround time. Here's the plan, and how to tell the three apart if it goes wrong.
Explainers
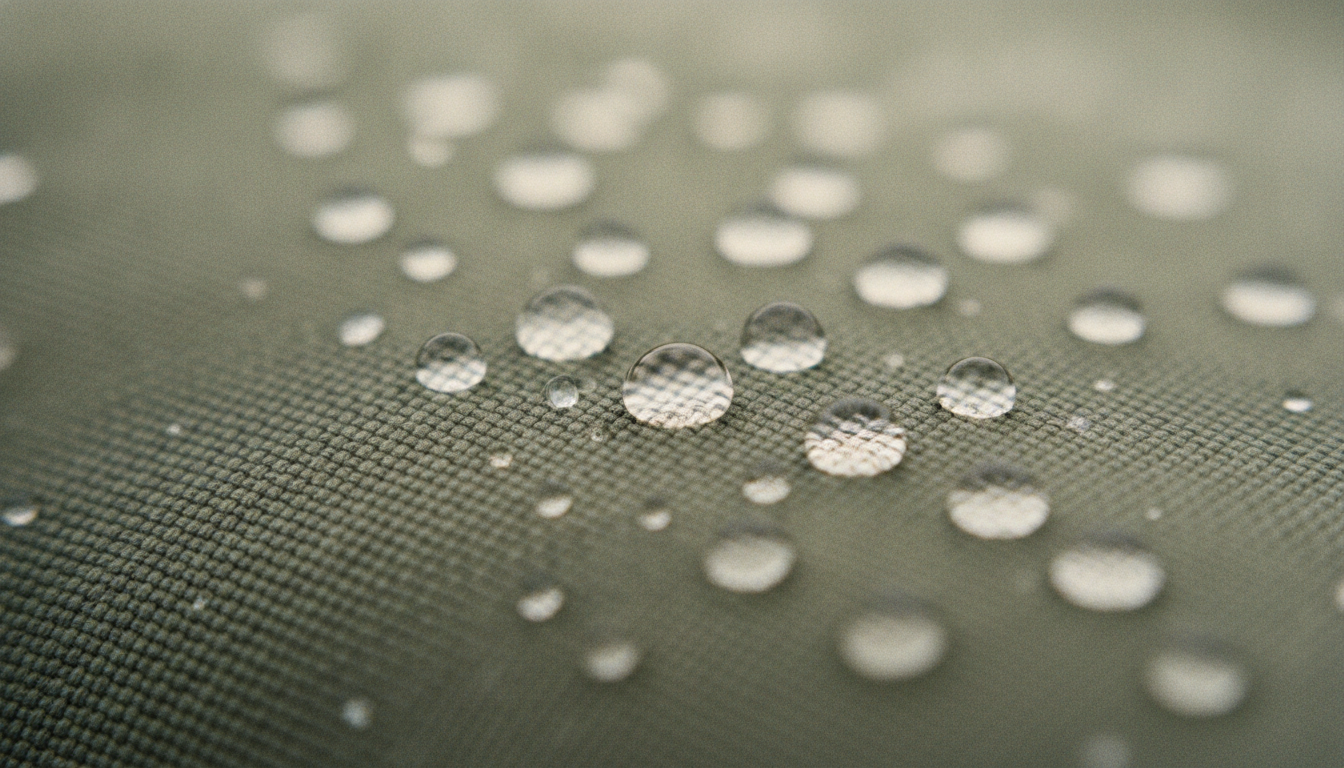
What is Gore-Tex?
It's a sheet of stretched plastic with nine billion pores per square inch, glued between the fabrics you can actually see. Knowing what that membrane does — and what the layer sitting on top of it does — explains nearly every complaint people have about expensive rain gear.